
Edward Haskell
What made it goal-directed was Harold Cassidy's growing concern, in the mid-Forties, with my predicament. Being a chemist, he discerned in my writings, couched though they were in what he called "incomprehensible jargon," the actual extension of the Periodic table to biology and social science. He had the patience to follow the reasoning step by step, pointing out mistakes, suggesting improvements and, in the process, mastering those parts of the technical language without which the new abstract concepts cannot be acquired.2
We supported each other more and more confidently through two more decades of Arthric reunions, and eventually produced a small, privately printed book, Plain Truth--And Redirection of the Cold War, and now the book before you. So, over the past twenty-odd years Harold Cassidy has been my constant coach, mentor, collaborator, and link with the academic community. Without him, we would not have held this symposium, and this book would not have seen the academic light of day.
But I want to say more: While my scientific writings continued in only xeroxed and offset-printed forms, Harold Cassidy (I keep repeating his full name to distinguish him from his equally illustrious literary brother Fred), Harold has published three "Two-Culture" contributions: the first, is titled The Sciences and the Arts--A New Alliance (Harper, 1962). Through it, scientists and humanists can recognize each others' contributions far better than they could before. The second, is titled, Knowledge, Experience and Action-An Essay in Education (Teachers College Press, 1969). This Essay is essential to everyone who wants to learn, and even more, to teach--Unified Science. And here, now, is the third: the bridge across which physical scientists can explore unified science's general background-theory, of which their own discipline is shown to be a special case. And so are, of course, the major theories and laws of the biological and social sciences. In reading this chapter, one recapitulates Cassidy's twenty-or-thirty year "phylogeny", from one-field specialist to generalist. Figure IV-11 is a diagram of what this statement means.
| 1. | Other Arthrites are: Frederick G. Cassidy, Professor of English Literature, University of Wisconsin, Madison, Wisconsin; George T. Lodge, Professor of Psychology, Old Dominion University, Norfolk, Virginia: and Willard V. Quine, Professor of Philosophy, Harvard University, whose clarification of ontological relativity informs the concluding section of this book. |
| 2. | Hence the Glossary at the rear. |
Summary of Theoretical Issues:
What Generalization of Mendeleev's
Periodic Table Means
HAROLD G. CASSIDY
1. INTRODUCTION
I would like, first, to summarize briefly the theoretical ideas present in Haskell's work as I have observed them appear and develop over the last twenty years to their present fruition. Then I would like to suggest in summary their meaning for the field of Education.
In my opinion, Haskell has discovered a scientifically-based pattern of a universal kind which is displayed in some respect by all of human knowledge and experience of Nature and Man. This is a large statement. Propositions of this kind have been advanced since the earliest days of philosophy, and in view of the signal lack of agreement among philosophers throughout the ages and today, it behooves us to be extremely wary of such statements. Yet strange things have been happening in science; and if I say that, in my opinion, this pattern that Haskell has discovered (and such discovery inevitably involves a degree of creative invention) constitutes an invariant-relation that enables translation between various developing fields of knowledge and experience, then at least metaphorically one can understand me to mean that like the Lorentz Transformations it makes the applicable relativity tolerable.
I assume then, that my task is to summarize the theoretical and empirical bases of this statement. That is, to give support to the hypothesis that Haskell has here a universal pattern; to show its nature and empirical reference; and to make it plausible for scientists to give it their attention. The pattern with which we are concerned is made up of several sub-patterns. I shall summarize each of these, as I see them, then put the whole together.
We are celebrating the centenary of Mendeleev's Periodic classification of the chemical elements. I need not remind you in detail of this work: you have before you (in the fold-out chart at the rear) a modern version of part of his Table. Essentially, what he did was to recognize a key variable, by classifying which other properties of the things classified fell into orderly patterns. This variable was atomic weight, and as you know it has been replaced by the more operationally constant property atomic number. Periodicity is displayed by the properties of the chemical elements when the elements are arranged according to increasing atomic number-and incidentally the evolutionary sequence of the production of elements must also display such periodicity. What Haskell has done is to find evidence that not only the Kingdom of Atoms, but that of Nuclei, of Plants, of Animals, of Cultures, displays a periodicity provided that the essential variables are properly chosen. This choice depends on cybernetic analysis, and its application leads directly to a sub-pattern known as `Coaction.'
Cybernetic Basis
The essential points needed to show the relevance of a cybernetic analysis in Haskell's work can be developed with the aid of a simple diagram. Cybernetics, "the science of communication and control in the animal and the machine," as Norbert Wiener defined it in a fatherly way, deals with processes. These are analyzed in terms of the variables that change as the process occurs. That which is undergoing the process is a system.
Consider a system such as an animal organism undergoing processes which we summarize by saying it is alive. It exists in a habitat which affects it (by inputs) and which it affects through outputs. The inputs comprise work-factors such as food, air, water, and so on, depending on the organism and controls upon them, as well as contingent factors over which the animal has little control until they impinge on it. The outputs are linked retroactively by feedback to the work components. In this feedback loop, and controlling it, is the governing factor. It receives information about the state of the output, and about the state of the habitat, and by its behavior can control, through the work components, the direction of the output.
 |
| Figure I-1 System. |
Information and control are clearly linked in the cybernetic analysis. It is the case that a system may comprise small or large groups of processes; from some ultimately single and simple process such as the reaction of two chemical substances, to the complicated, interlocked system of an unknown number of homeostatic and other processes called a living organism and, indeed, beyond to the behaviors of groups of organisms. It is the case also, that a factor that in one system is an output may exercise a governing function in an interlocking system, or may function as work component in another. This is in agreement with what we observe in the world around us.
Coaction
In the cybernetic analysis of the more complex and organized systems we recognize two distinct kinds of factors. There is the work component or components, which we shall designate X, and the governor, or controller, which we shall designate Y. Of course, the governor does work too (the strategic work), and we have simplified the relationships very greatly. There will be cases of a system made up of sub-systems, one controlling in some respects, not in others, and so on. Let us stay with the simpler case. Now, the processes that characterize X may, in the interaction with Y, be accelerated or in some way enhanced ( + ), or may be unaffected ( O ), or may be decreased ( - ). Similarly, the processes that Y undergoes. When the possibilities are cross-tabulated, it becomes evident that there are nine and only nine of these qualitatively different `coactions.'
 |
| Figure I-2 Cross-tabulaion of two coacting entities. |
In ( + , + ) both gain. If X and Y represent two organisms, this might be called symbiosis, or mutualism. The relation ( + , O ) may be illustrated by the case of an older brother (Y) who, without knowing it ( O ), sets a constructive example ( + ) to a younger (X). This may be called commensalism. It is important to notice that by this classification Haskell discovered three new coactions, ( O , + ), ( - , O ), ( O , - ), which occur widely but had not been recognized before. To me, it is very impressive when a theory makes possible the discovery of new relationships, and especially when it completes a set of philosophical categories.
We know, of course, that there are infinite varities of coactions, both within the qualitative differences, and quantitatively. This fact is dealt with by geometrizing the Table.
Geometric Representation
When the Table is put into a coordinate system of a special kind that you have before you, several new features appear. Eight of the coactions fall neatly upon the axes or in the quadrants, as shown1. The ( O , O ) coaction may be placed at the origin if there are no coactors. But in actual systems it must be interpreted as a third "axis," the Scalar Zero circle. This, I think, was a stroke of genius on Haskell's part. How do you decide whether a coaction has net ( + ) or ( - ) or ( O ) effect? You must have a reference, which is the state of the system before the coaction is initiated, or a reference point must be picked. This then establishes the ( O , O ) state and is, of course, neutral to all coactions. Its value is thus plotted as the radius of a circle, the Zero-Zero circle ( O , O ).2
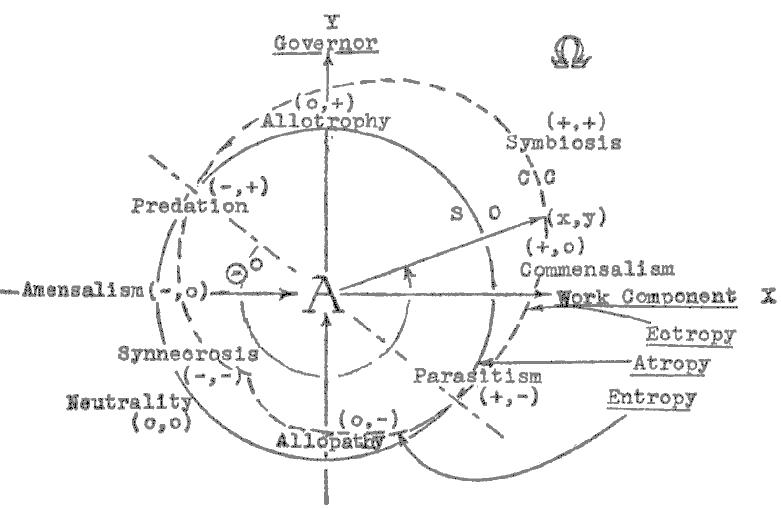 |
| Figure I-3 The Periodic coordinate system: One Period.3 |
As an example, in labor-management relations there is a profit-sharing arrangement known as the Scanlon Plan. An essential feature of the Plan is to have a reference period before it is put into operation, so that one will know whether there is actually a profit or loss under the Plan and how much it is. The value or range of a variable, measured at this time, would serve to place the ( O , O ) circle in the upper right half of the manifold, and of net ( - ) within the reference ( O , O ) in the lower left. This yields a `Coaction Cardioid.' Along the Axis of Atropy bisecting quadrants 2 and 4, the magnitudes of x and y are equal, but the signs are opposite, so the net coaction is zero. To the right and above this axis is what the philosopher Braithwaite calls the `cooperator's surplus.' Once more we complete the philosophical categories by calling attention to the `conflictor's deficit,' as we name it, in the lower left, net ( - ) part of the manifold.3
A second sub-pattern is hierarchical. It is related to periodicity. The archetypical structure is that of the electron energy-level structure of atoms. Consider the structures of the first few members of the Periodic Table, arranged in the form of a System-hierarchy. Here System refers to the whole Kingdom, and the terms `Period ', `Stratum,' and `Substratum' have the following significance.
 |
| Figure I-4 Part of the Kingdom of Atoms. Major Structure 2. |
In this particular Kingdom, Period 1 contains one Stratum (the `shell') and one Substratum, the orbital. Period 2 contains two Strata, the closed first shell and a second shell which shows three possible Substrata, the three orbitals. Period 3 contains three Strata, the closed first and second shells and a third, which contains five Substrata. And so on. This structure exemplifies a System-hierarchy, which has the characteristic that each higher Period comprises all previous Strata plus one new Stratum, which modifies and is modified by the others.4 This important last characteristic is shown by Period 2, for example. The first shell of electrons is modified by the presence of increased nuclear charge and also of the second shell of electrons.
In the cases of plant and animal Kingdoms, the conventional taxonomic classification is not suitable for constructing System-hierarchies, nor for displaying periodicity. Haskell has therefore offered the additional classification scheme below which offers new insights, it seems to me. This scheme is based on cybernetic analysis. Essentially, the Periods are distinguished by a sharp change in the organism's control of its habitat. The whole scheme is based on this relationship, central to evolutionary changes in all natural Kingdoms.
 |
| Figure I-5 Part of the theoretical System-hierarchy, show the logical necessity of distinguishing habitat from environment. See Chapter 11. |
The steps in the hierarchy occur with changes from control-by-habitat to control-by-organism.
For example, the System-hierarchy of the Kingdom of Plants begins in Period 1 with the Protophytes and Thallophytes. These simplest living things could colonize bare rock, and convert the surface, as they grew, multiplied, and died, into a kind of 'soil.' Thus they changed their habitat. At the same tie this new habitat could select for new kinds of plants. Period 2 is recognized as comprising the Bryophytes and lichens which, having roots or their equivalents, could draw nourishent from the 'soil.' At the same time they sheltered the Period 1 plants which were becoming modified too. In Period 3, the Pteridophytes, a great increase in control over the habitat came with the development of vascular tissues, stems, and leaves. Here the energy source of the sun could be more efficiently exploited, and nutrients better distributed longer distances in the plant. Finally, Period 4 plants, the seed plants, are characterized by any improvements of the habitat, including in various cases improved selective fertilization procedures; protection of the zygote in a shell; increasing its survival chances by including with it a source of nutriment.
 |
| Figure I-6 Kingdom of plant ecosystems. Major Stratum 5.* |
* Editor's Note. Missing from this figure are the Sub-strata. These would, if entered, appear on the right, as they do in Figure I-4. Sub-strata represent the plant's ontogenetic stages. In accordance with Haeckel's Law, each Stratum (which developed phylogenetically) is composed of its own number of (ontogenetically developed) Sub-strata. See Chapter II. This structure may, for some people, be obscured by the fact that the controlling Stratum develops species whose adult forms occupy lower Stratum niches. Modern shrubs and grasses, for example, (Stratum 4), often occupy what used to be, in ancient times, fern niches (Stratum 3). What were once fern lands are now, in many places, grass lands. Nature, as Einstein said, is subtle. To those who see her subtlety, as Einstein did, she is not vindictive.
This additional type of classification opens new avenues for experimentation such as are suggested by terms like `input,' `output,' `feedback,' and so on. At the same time it brings this Kingdom into the pattern of the Periodic Coordinate System. A similar approach deduces a System-hierarchy for Animal and one for Human ecosystems. (Chapters II and IV).
We have, then, a grand pattern which consists of the Periodic Coordinate System for the description of the state, and changes in state of systems, subsystems, and very subordinate systems, in any given Period. Each Kingdom, from Particles to Human Cultures, comprises a System-Hierarchy, each Period of which is describable in coaction terms. Superimposed on all of this is a System-Hierarchy of Kingdoms.5 Here we are not certain about the numbering of Periods. However we do know that Particles and Atoms must have lower numbers, increasing in that order, than Molecules, Geoid Systems, Plants, Animals, and Human Cultures.
It is evident, as time has passed in the history of our world, that there has been a trend from the most chaotic state of primordial matter via a gradually habitable Earth, and the first appearance of Life, to our present state. It can be asserted, in broad terms, that two time-related phenomena are visible here. There is the Second Law of Thermodynamics which says that in any closed system undergoing process, a quantity called the entropy tends to be maximized. As far as we can judge this is a law without any exceptions-almost certainly without terrestrial exception. At the same time, we observe the appearance of organized, information- and control-employing creatures. These are always associated with open systems, and they decrease net entropy at the expense of their habitat. We must thus confirm, as many others have suggested, that there is also a drive in a direction which, since it has led to our existence, we can only speak of as `upward'; that is, to increased complexity and the organisation needed to keep it viable.6 These two directions are symbolized by Haskell in the diagrams, taking a leaf from Teilhard de Chardin, as `Alpha,' A, and `Omega,' ![]() . They confer limits and rational bias on the entire formulation.
. They confer limits and rational bias on the entire formulation.
What I wish to have made clear is that we have here an ambitious attempt at a Grand World-view. Haskell has provided us with a pattern of invariant-relations, the System-hierarchies and Periodic coordinates, which enable us to translate between all the sciences; he has provided us with a set of compatible interconnected frames of reference.
Very basically, the essential problems in education are those of our whole culture: communication, control, and direction. Education depends in considerable part on rational discourse, though there is also a large and important non-rational component that is learned by non-verbal means: by example, and "showing how." We have seen how Haskell has discovered an overall pattern that comprises compatible frames of reference (Periodicity and Stratification) for all the sciences. This pattern, couched in operationally constant language, allows translation between the present languages of the sciences, and so should counter the present ever-increasing fragmentation among disciplines.
We see in this work the potential for improved communication, for control and direction in education. The improvement in communication comes from the use of operationally constant concepts. Words like `conflict,' used commonly and confusingly for ( - , + ), ( - , - ), and ( + , - ) coactions, can be cleared up. The people who use them can be led out of the semantical swamps in which they flounder under such usages. Precise use of words and symbols can be encouraged, and made to yield positive, constructive results.
Control is important too. To obtain an holistic education, an education that opposes fragmentation of the curriculum, and alienation and loss of integrity in the student, the education must have a rational structure. It must depend on many constraints such as always trying to tell the truth in clear and precise language. If the truth cannot be communicated in this way then the teacher must be constrained to alert the student. It should have an orderly sequence of progression that is constrained to fit the stage of physical, mental, and spiritual growth of the child. It should have an intellectual skeleton that is capable of supporting a wide variety of features as it is fleshed out with educational growth. What I am suggesting is that Haskell's world-view provides just such an intellectual skeleton. We know that the concept of coactions can be grasped by very young children--Haskell has demonstrated this. A young child can grasp, even if in a very simple way, some of his interrelations with his habitat. The thing we must be wary of, however, is the tendency in education to idolize a theory. We must engineer into any application of this work an openness to rational change, an opportunity for a variety of approaches and interpretations, and a self-revising feedback.
One implication for education that comes from this work is not only that the curriculum must be given an holistic structure, but the administrative side also. Application of systems theories is already showing remarkable results in certain school systems at the primary and secondary levels. It should be applied at the college level.
Empirical examples of the calculation of coactions may be helpful. Two aspects of the general coaction problem may be mentioned, of which the first only is dealt with here. The first is calculation from raw experimental data to a form that may be plotted in the Periodic Coordinate System. This takes care of data within Periods. But transition from one Period to another (up or down) in a System Hierarchy will probably require the use of step functions of some kind, and are not dealt with here.
We take our examples from the work of Gause7. Gause studied the growth behavior of protozoa, yeasts, and other organisms as they were cultured on liquid media, controlled as needed with respect to temperature, composition, pH, availability of oxygen, and accumulation of waste products. Conditions were such that the population of protozoa (or other organism) would reach a fixed level and remain there indefinitely. This was the saturation population (K) and represented a steady state with respect to the volume, or bio-mass, of protozoa present per unit volume of culture. The organisms were grown separately, and in mixture. Figure A-1 is a reproduction of Gause's Figure 10, p. 31.
 |
| Figure A-1 Growth of the population of Paramecium caudatum and P. bursaria (nutrients: S. exiguus + B. pyocyaneus). From Gause.7 Figure 10, p. 31. K is the total volume of individuals of the particular kind in 1 cc at the steady state level. |
In one method of calculation we utilize Gause's K values. This gives an end-result of the processes traced in Figure A-1. One might, of course, calculate every point on the curves of mixed growth and thus trace out a line of behavior that ends at the steady-state values K (shown in Figure A-3).
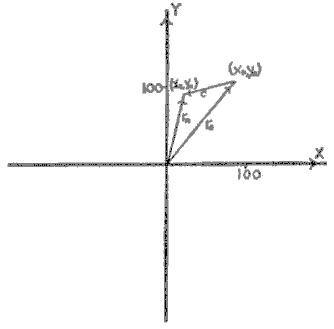 |
| Figure A-2 The data of Figure A-1 are plotted to show the calculation of the coaction vector 'c'. |
From Figure A-1 we see that, grown separately, caudatum (Y) attains the volume of individuals per cc 107. This is yo. Similarly, bursaria (X), attains the value xo = 85. As a result of the interaction when the two are grown together, the steady state that is reached shows the values yn = 90; xn = 22. These values are plotted in Figure A-2 in the usual way. They define two vectors ro and rn. The coaction vector is measured as c = (xn, yn) - (xo, yo), the Vector difference between ro and rn. The direction of this vector shows (as the numerical data showed) that mutual depression ( - , - ) has occurred. From the above data the components of c (a, b), may be calculated by the usual method to be a = - 63; b = - 17. By trigonometry,
c calculates to 65.3 units of magnitude (the squares dispose of the negative signs). The angle of c calculates, from the tangent and inspection of the direction, to be 195°7' (which preserves the negative direction). This places the coaction vector in quadrant III, i.e., between 180° and 270°. We must then assign to c the negative sign: - 65.3 units.
Coaction is always plotted relative to the (O ,O) reference circle. This is a circle with radius ro (Figure A-3). The value ro is thought of as a magnitude only. Moreover the symbols ( O ,O ) are related to the symbols ( + ) and ( - ), and are not numerical zeros.
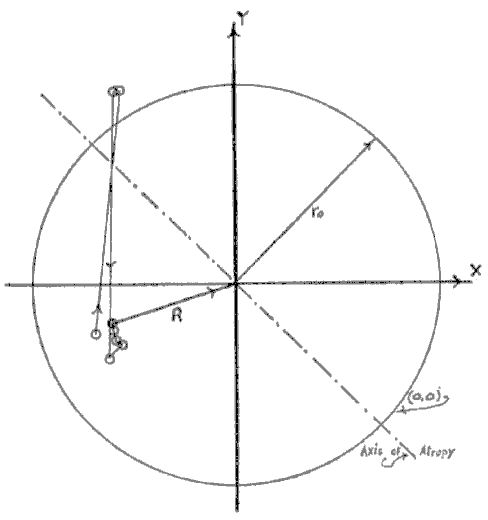 |
| Figure A-3 The RO circle [reference zero , or ( O , O )] of radius ro is shown together with a plot of the line of behavior of the system from (xo,yo) to (xn,yn) in the phase space of Quadrant III ( - , - ). The data are from Gause(1), Figure 10, p. 31. The wide fluctuations in the first few points are well within experimental error that goes with the presence of only a few organisms. The Axis of Atropy error is shown, -.-.-. |
The Periodic Coordinate System is not Cartesian, though it does resemble the Cartesian in quadrant I. The axes are calibrated numerically from the origin outward. However, the X axis is interpreted to be directed from left to right; the Y from below to above. There are singularities in quadrants II and IV. These are two points which, with the origin define an axis, the Axis of Atropy, along which at any point the magnitudes of x and y are equal but their signs are opposite, so that the net coaction is zero (Figure A-3). Now, because of the defined directions of the X and Y axes, ro takes on the property that, on the net negative, or left-hand, part of the manifold it is directed toward the origin while in the other half it is directed away from the origin. This makes it so that if c is added to ro (which takes the same angle as c) the resultant vector R will fall within the ( O , O ) circle of radius ro when the coaction is net negative. It will extend outside of the ( O ,O ) circle when the coaction is net positive. As we said, coaction is always relative to the ( O ,O ) or RO circle. Thus all net positive coactions (a + b > O ) will lie outside of the R0 circle, and all net negative coactions (a + b < O ) will lie inside of the circle. Where a + b = 0, we have the intersection of R0 and the axis of atropy. This formulation causes the net plus and net minus phase spaces to stand out clearly and strikingly.
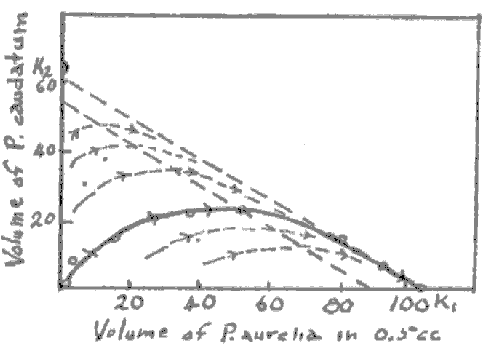 |
| Figure A-4 Relative curves of coexistence of P. caudatum and P. aurelia. The solid line is from experiment; the dashed lines are from theory. P. aurelia eventually completely replaces P. caudatum under all conditions of relative abundance present at the start of the experiment. From Gause (1), Figure 4, p. 19. |
As another experimental example we take the case where P. aurelia grown in the presence of P. caudatum is found to completely displace caudatum (Figure A-4). Grown separately aurelia (Y) attains a steady state of 105 volume units per 0.5 cc; caudatum (X) under the same conditions attains 64 volume units per 0.5 cc. Grown together, the steady state is reached with yn = 105; xn = 0. Then ro = 123; (a,b) = (- 64,0) and c is -64. R then is 59 at the angle 180°.
We have gathered in Table A-I data from two experiments of Gause and from two of his theoretical calculations. Because we are dealing here with different organisms, the problem of how to calibrate the X and Y axes arises between experiments and within experiments (the problem is that of `utilities' in economics). We have arbitrarily "normalized" the data to the value ro = 100 for all the data, which is why these numbers are different from those quoted above which were taken directly from experiment. This may not be the best way to make comparisons, but it serves until a better is found. This new coordinate system cries for mathematical sophistication.
| Table A-I Data from Gause (1,2) and calculated values of coaction | |||||||||||||||||||||||||||||||||||
|
|||||||||||||||||||||||||||||||||||
| Note. The data have all been calculated for ro = 100 units (volume of organism per cc). c represents coaction; a and b are the ordered pair that describe the vector c; |
It should be noticed that the resultant vector R is not a coaction, but a convenient means for visualizing the interaction. The values of R from Table A-I are plotted in Figure A-5.
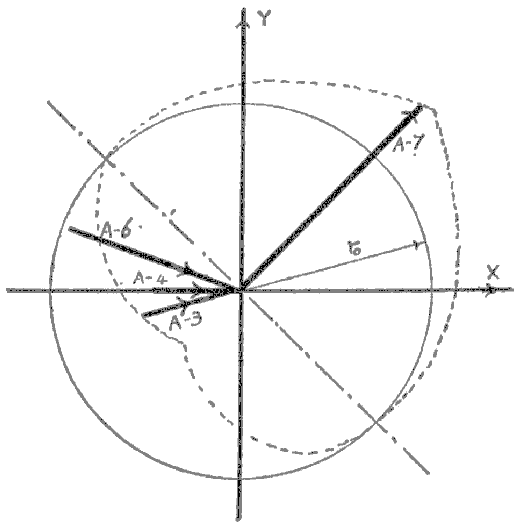 |
| Figure A-5 Summary of data from Table A-I. |
In summary, the coaction is calculated in a conventional way to give a coaction vector c with length |c| and direction F. The sign of the value of c as determined from the relation c is ( + ) when (a + b) (the ordered pair that describes c is (a,b)] is larger than zero; minus when smaller, and zero when a and b are equal in magnitude and opposite in sign. For a perfectly symmetrical figure, c is (+) over the range of angles from ![]() = 0° to 135° and from 315° to 0°; c is ( - ) from 135° to 315°. At angles of 135 and 315, |c| = R.
= 0° to 135° and from 315° to 0°; c is ( - ) from 135° to 315°. At angles of 135 and 315, |c| = R.
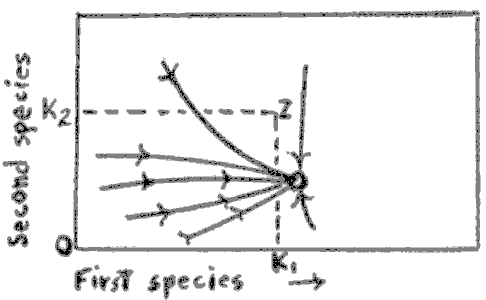 |
| Figure A-6 This is the lower part of Figure 4 from Gause & Witt8, p. 604. The coaction is mis-named commensalism by these authors. The distance from the origin Z is our ro; that to the focus of the curves at the steady state, is our ro. This figure is drawn according to the theory and does not describe an experiment. |
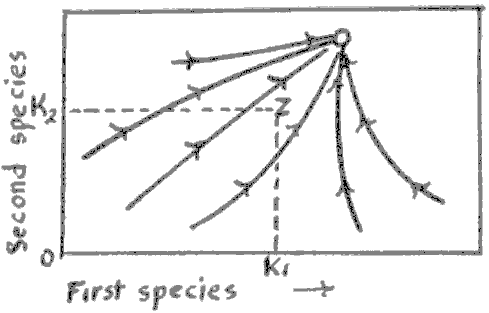 |
| Figure A-7 This is the upper part of Figure 4, Gause & Witt8, p. 604, see Figure A-6 for definition of terms. |
| 1. | Editor's Note. The first quadrant is Cartesian, but the other three are not: Two of the axes are directed inward. A method of calculation is shown in the Addendum to this chapter. |
| 2. | Editor's Note. Also called the Circle of Atropy, relative to which entropy and its opposite, ectropy, can be represented and measured, as discussed below. |
| 3. | Editor's Note. The limits of the Periodic coordinate system are thus obviously the point of maximum entropy A and the region of maximum ectropy |
| 4. | Editor's Note. This Period-Stratum relation has no fundamental exception throughout unified science Its analogous Sub-stratum-Stratum relation has an exception: its second Stratum has 3 Sub-strata (instead of 2), the third Stratum has 5 (instead of 3), the fourth has 7 (instead of 4), etc. In the atomic case, not one but two Sub-strata characterize each additional Stratum. |
| 5. | Editor's Note. Also called Major Periods: just as Sub-strata build up into Strata, and Strata into Periods, so Periods build up into Major Strata (Natural Kingdoms), and these build up into Major Periods (Natural Empires). The Major Periodic Table is the natural classification of Unified Science. (Chapters IV and V.) |
| 6. | Editor's Note. The term ectropy was suggested for this process by Willard V. Quine in a discussion following this symposium. Its brevity and elegance have led to its adoption throughout this book. The term atropy was coined by Haskell a few days later. The relations of concepts entropy, atropy, ectropy are shown in the Periodic coordinate system above. |
| 7. | G. F. Gause, Verifications Expérimentales de la théorie mathématique de la Lutte Pour Ia Vie. Hermann, Paris, 1935. |
| 8. | G. F. Gause & A. A. Witt, The Armrican Naturalist 69, 596 (1935). |
| Chapter II |